

/admin/enrollment) shows registration activity and intake visit issues.
Metrics
The dashboard opens on the Table tab. Switch to Graphs for session mix, arrivals by hour, daily new-vs-visits, and the staff leaderboard. Today / Week / Month / All Time stay visible on both tabs.Table filters
Filter by period, staff member, or student/staff name search. Today / This Week / This Month count students with a new registration or a returning intake visit in that window (America/New_York), not only the original file-created date. Each row shows who first registered the student (name + email).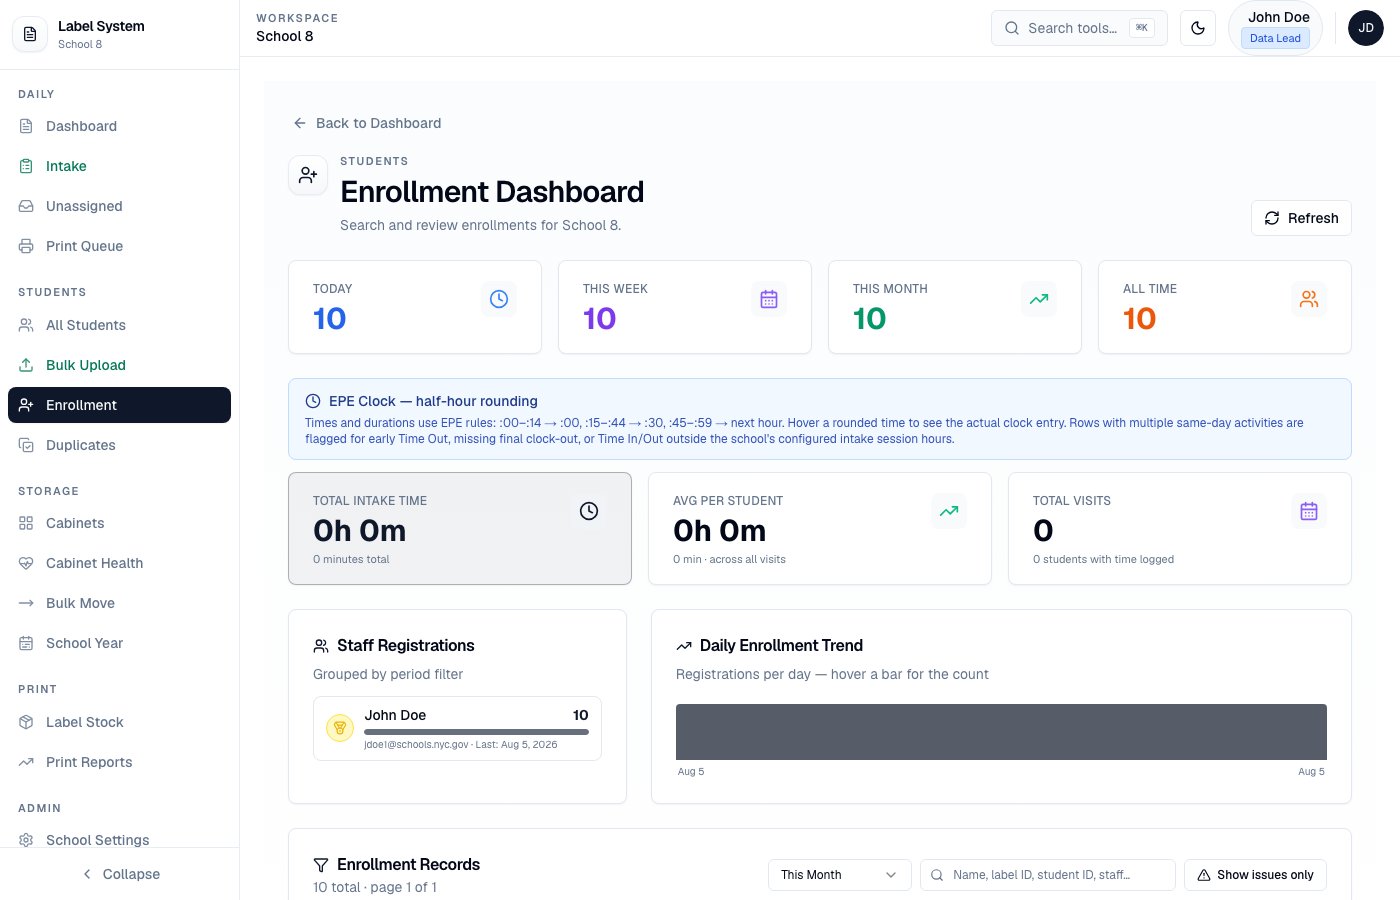
Enrollment dashboard — metrics, EPE clock notes, and staff registrations
Intake issues
Enrollment can flag visits with:
Same-day Leaving → returning intake → Leaving is allowed. Staff handoffs stay Staying until the student actually departs.
Missing Time-Out rows sort to the top of the current page and show a red Missing Time-Out badge with Fix.
Use Show issues only to focus on rows that need attention. From Intake, the yellow banner’s Fix dialog includes a how-to, Set End Time (now / session end), and Dismiss & Re-admit for earlier open visits.
District analytics (Admin)
From Enrollment, Admins can open MotherDuck Analytics (/admin/motherduck-analytics) for warehouse charts synced from MongoDB. In-app Analytics (/admin/analytics) is available to Admins and Data Leads for live MongoDB metrics.
See Analytics.